Enterprise Solutions & Service
- HOME
- Solution & Service
- Enterprise Solutions & Service
Dr.Sum EA / MotionBoard
BI tool that visualizes "business forms"
Marubeni Software & Technology (Thailand) is an official distributor of WingArc1st products in Thailand and provides support in Japanese, Thai and English. WingArc1st’s BI solutions can be used in various sections from management and information systems to business operation as well as by personnel of all positions including the person in charge, managers and executives, bringing undoubted benefits.
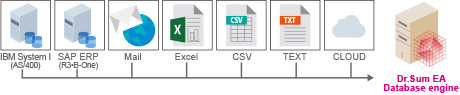
Dr. Sum EA Aggregation/analysis platform
- Existing assets / operations done by Excel can be effectively used.
- With GUI allowing intuitive operations, can be used by anyone without having to learn technical knowledge.
- Provides an environment for speedy aggregation and fast analysis of even a large volume of data.
- Integrates data from various data sources including in-house systems and cloud systems.
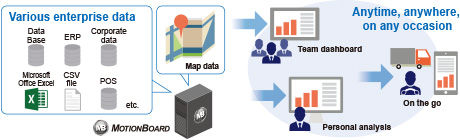
MotionBoard Data empowerment dashboard
- Dynamically visualizes a wide range of data in real time with speedy analysis.
- An optimal dashboard for each business purpose can be created without any hassle thanks to the easy-to-operate GUI and all sorts of charts available.
- Can be used whenever and wherever on tablets as well.
Usage examples
Production management - Visualizing productivity and stock status
Analysis of cause for defective products
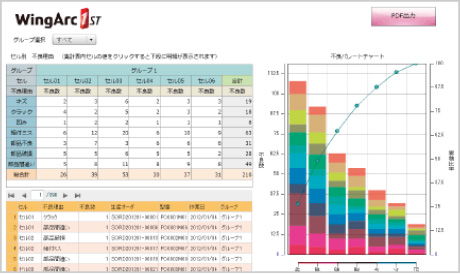
Can automatically arrange the aggregated data in descending order and calculate the cumulative ratios. For instance, it helps to confirm the number of defective products during the production and the breakdown of the causes.
Yield rate, operating rate, success rate
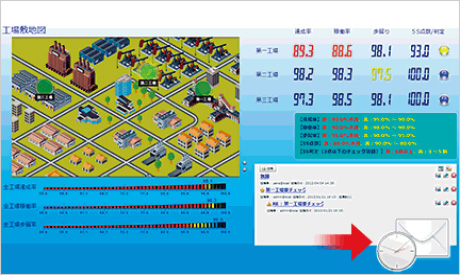
It is possible to issue an alert and automatically notify the person in charge if a set threshold value is exceeded. It is also possible to capture conditions in real time-e.g., to check that the operating rate value has not become abnormal.
Recording daily operating reports
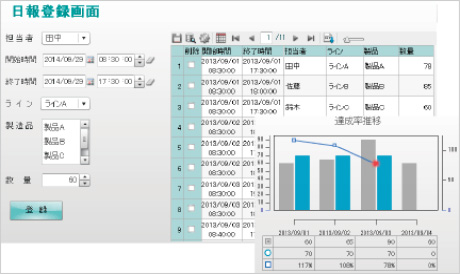
It is possible to save detailed records in a linked database or CSV. In addition, performance data is reflected as soon as it is input, which enables it to be compared to plans, etc. Simple data sources such as questionnaires and daily reports can also be input easily.
Tracking inventory
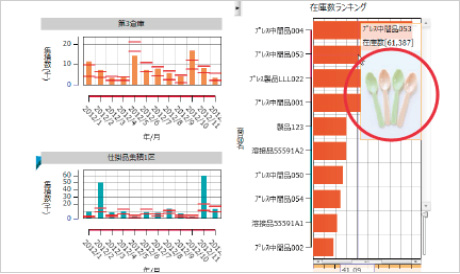
Using a combination of line and bar graphs, it is possible to track whether inventory is being maintained within an appropriate range. It is also possible to display an image by mousing over data of interest, which makes it easy to understand which product information is being shown.
Management Plans - Visualizing information required to make management decisions.
Profit and loss statements(PL sheets)
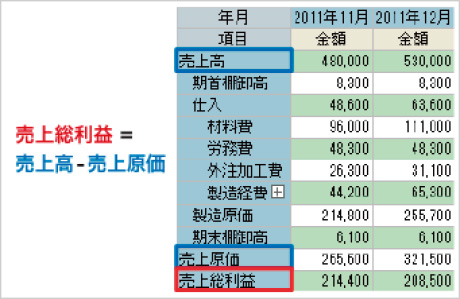
It is possible to calculate and output values that do not exist in data sources, such as displaying vertically integrated records that combine data aggregated from various tables in a single table, performing basic arithmetic operations on aggregate records, and so forth. It is also possible to link drill-down and drill-through results in the form of breakdowns by different segments (e.g., by department, by project, by product) based on the PL sheets.
ROE simulation
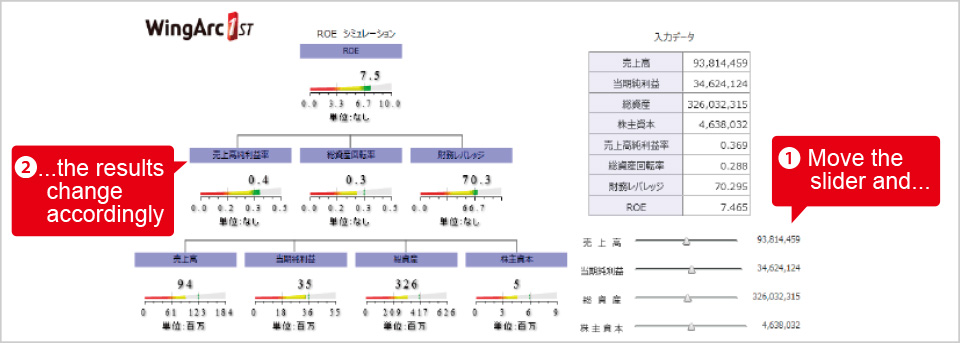
When the slider is moved, the calculation results based on the relevant figures immediately change accordingly. It is possible to create forecasts for reference purposes, such as calculating the ROE (return on equity) if net income decreases.
Forecast results and actual performance
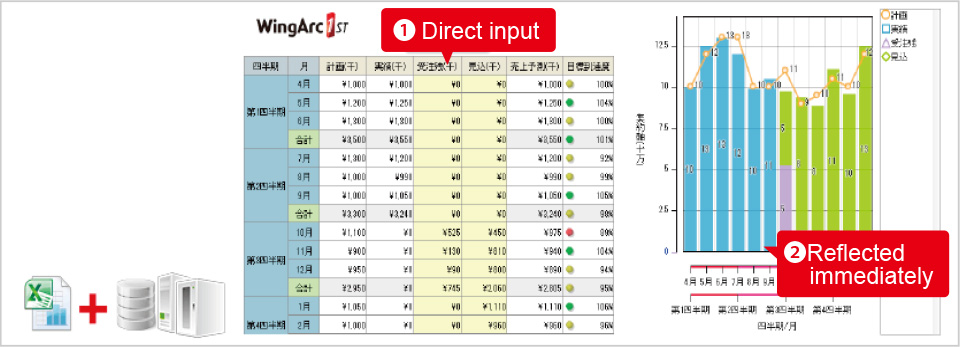
Direct input of estimates based on projected values created in Excel and actual performance values from the core system on the dashboard is possible as well as use to run simulations (e.g., to see how forecast values will change).
Sales Management - Visualizing fast-selling products and customer attributes.
Target success rate and sales distribution ratio by brand
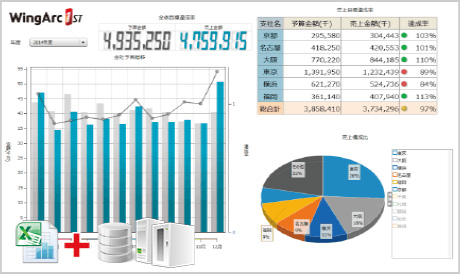
It is possible to calculate ratios through virtual integration of budget data managed with Excel and cumulative performance data in the core system. *Virtual integration = integrating information from different data sources and representing it on a single dashboard screen.
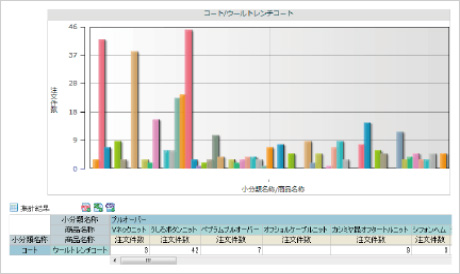
Single-item analysis, ABC analysis, crossover analysis
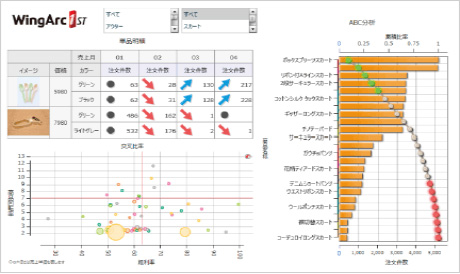
Color-coded display based on set threshold values is possible, which makes it easy to assess sales status. By visualizing the correlation between three sets of data using a bubble chart, it is easy to determine fast-selling products and slow-moving products (e.g., by using crossover rates).
Customer analysis, RFM analysis
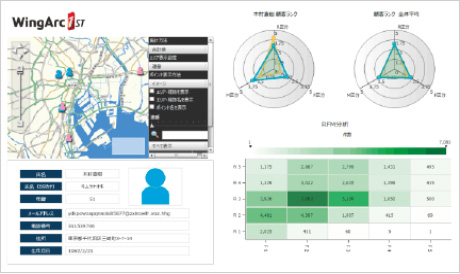
Users may freely change RFM (a customer analysis technique) threshold values as they desire, which allows intuitive analysis. Since GEO (a mapping function) is provided as a standard feature, it can be used for area marketing as well.
Market basket analysis, repeat analysis
It is possible to monitor conditions such as which other products a customer buys at the same time as a given product or what products customers buy on a repeat basis and apply that information for future product displays, orders, etc.
MENU
Marubeni Software & Technology (Thailand) Enterprise Solutions & Service
Enterprise Solutions & Service
Contact Us
Inquiries are received by phone and e-mail, please do not hesitate to consult us.
![]()